Telescope Sites II: Weather
Outline
While location matters a lot for what a telescope can observe, the most important thing in practice is weather. No, seriously. A nominal (30 degree elevation / 60 degree zenith angle) telescope located at a pole still has access to 1/4 of the sky. And a mid-low latitude one (especially with better pointing) may over the course of the year have access to the majority of the sky.
But even a really good site can still lose 20% of nights due to weather, and a bad site (eg: most campus telescopes) can have seasons that cost them ≥90%.
This post is to a large degree an expansion/explanation of work that I’ve already done and have posted as scattered configuration files in the simulation code. The sites that were in the paper(s), and a full-ish list including the unused/extras and some graphs of the data are shown. All sources are in the footnotes.
Hopefully it’s now going to be more useful to someone.
Existing Work
Let’s start with the six sites I looked at in the EPRV technical report / EPRV working group final report / paper 1:

 at each site for each night over the course of a year. Because of the need to bin data to get useful accuracy, the graphs have visible jumps. Quality varies from per-month to per-semester to just one value for the entire year.")
I gathered the data used in the graph from multiple different sources123456 and while I’d like to think that it’s reasonably high quality, there are some limitations in data resolution and duration of measurements. Also, it was quite common to have to estimate values by measuring the heights of bars or the like on a graph.
There were also a bunch of sites that we didn’t use that I also ended up with sources for, and in some cases older data for the same sites. Newer datasets were preferred because they were expected to better correspond with current instrumentation, but more importantly, weather is likely to be slowly changing because of climate change.
Unused and Duplicate sites
Besides the 6 main sites, there were another 5 that I ended up with full data tables for that weren’t used at all or were dropped during the early phases. There were also some sites that I have nominal weather data for that weren’t shown at all.78910
Looking at the three cases where I have data for the same or nearby sites:
, and one on Mount Hopkins (MMT). All three correlate fairly closely and show monsoon season.")


That data for nearby sites stay close (and change slowly over the years) points to the data being “good enough”. Different sites being best at different times of year, and the expectation of weather at them being uncorrelated are parts of why I think an EPRV precursor for direct imaging characterization should be at several different sites. (We need the cadence!) These graphs were generated with other_weather.py, and the full data table as a CSV (with columns for the day and month to make translating it into other timescales easier is SiteWeather_all.csv.
Other Issues and Future Work
Since I generally was dealilng with figures instead of proper tables, these required some conversion/pixel counting. The actual weather code in my simulations assumes 365 day years (well, it also reuses February 28 for leap-years), so all of the data had to be reformatted for that.
An annoying thing is that often sites that have been operating for decades only have formal weather statistics for a handful of years and/or group things on a per-semester (or even per-year) basis, limiting their accuracy.
This listing is far from comprehensive. There are many more sites scattered across the literature (only some of which I have notes on), but assembling this weather information would be a bit silly unless there’s a need for more simulations.
Footnotes
-
Mauna Kea, Hawaii used figure 15 in a site survey (Bely 1987). ↩
-
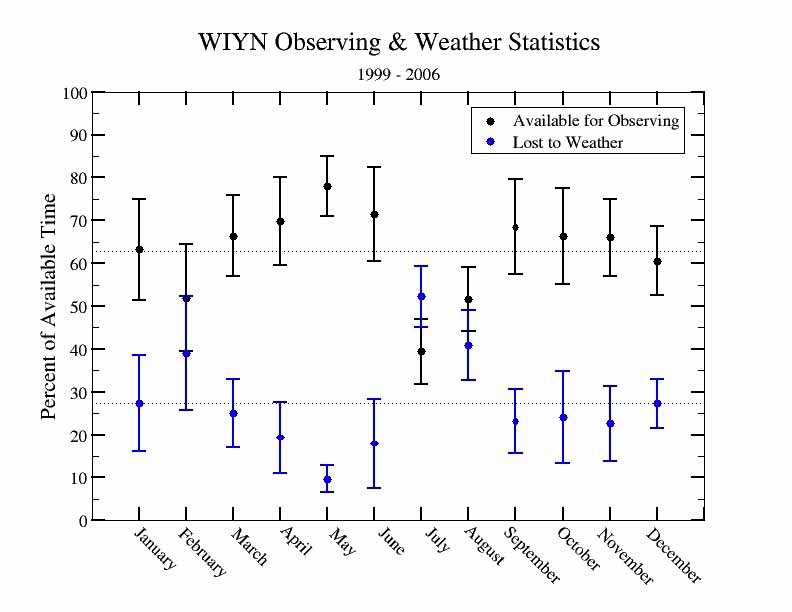
Kitt Peak, Arizona used graph for WIYN data. It was at http://www-kpno.kpno.noao.edu/Images/wiynWeather_stats.jpeg but that has vanished in site reorganizations. As such, I’m archiving a copy of it on this blog. There was no formal publication that I am aware of. ↩
-
Las Campanas, Chile: Strictly speaking, this is really for La Silla. Given that the sites are grouped together and relatively close (<27 km), I considered using the same weather acceptable. For the data itself: https://www.eso.org/sci/facilities/lasilla/astclim/weather/tablemwr.html (which runs from January 1991 to May 1999) using the optimistic assumption of photometric+spectroscopic nights counting. Like with WIYN, this has no citation. ↩
-
Calar Alto, Spain: Barrado et al 2011 (an operational report), specifically figure 4 left, which covers 2000-2009. In the code this table is “CalarAlto2.txt”. ↩
-
Sunderland, South Africa: the telescope report by Petri et al 2016 (figure 2, which unfortunately only gives per-semester and is over 2011-2015.) ↩
-
Siding Springs, Australia: https://aat.anu.edu.au/about-us/AAT (facts and figures section) gives 65% clear nights. Alternatively, the 35% figure can get a handwavey justification from several annual reports. The 1997-2000 ones have ADS info (Davies 1997, Davies 1998, Mould 1999, ??? 2000) and give a higher number (36.8), but variations (including a number of dryer years in the 2000s) can justify the existing figure. Also, in the time since I first found them, they no longer have a good web source. ↩
-
The data I didn’t use Kitt Peak (or Cerro Tololo) due to the age of the data was at http://www-kpno.kpno.noao.edu/environ/KPWeather_stats.pdf, though has been lost in site reorganizations. Fortunately, it was also formally published (Crawford 1983). Table 3 covers KPNO for 1964-1981, and CTIO for 1977-1982. ↩
-
MMT uses http://www.mmto.org/sites/default/files/mmtweatherpercent.jpg (another lost image, but this one has been archived), covering 2009-2013. Initially Chaffee and Foltz 1986 (table 5, covering 1982-1985) was considered, but was ultimately discarded due to age and lacking information for August. As such, this is yet another dataset that cannot be properly cited. ↩
-
The Magellan Telescopes (located at Las Campanas) use fig 5 in the Osip et al 2008 operations report. This is averaged out to give per-semester values. ↩
-
This is the same telecope at Calar Alto, and is “CalarAlto1.txt” in the code. It uses figure 1 in Birkle and Hopp 1987 (also an operational report), and covers the years 1970-1984. ↩