A fast and simple atmospheric absorption approximation
Why
While site selection matters both in terms of geometry for observations, and weather, even on clear nights, the atmosphere will continue to get in the way. Unfortunately a lot of models tend to be fairly complex and not plug and play (eg: HITRAN and US standard atmosphere). Worse still, a lot of fancier models are, uh, very proprietary and/or have limited wavelength/frequency coverage. Hence this, which I used my contributions to: the EPRV technical report (part of the EPRV working group report), HabEx final report, and my first, and second first author papers.
Equations
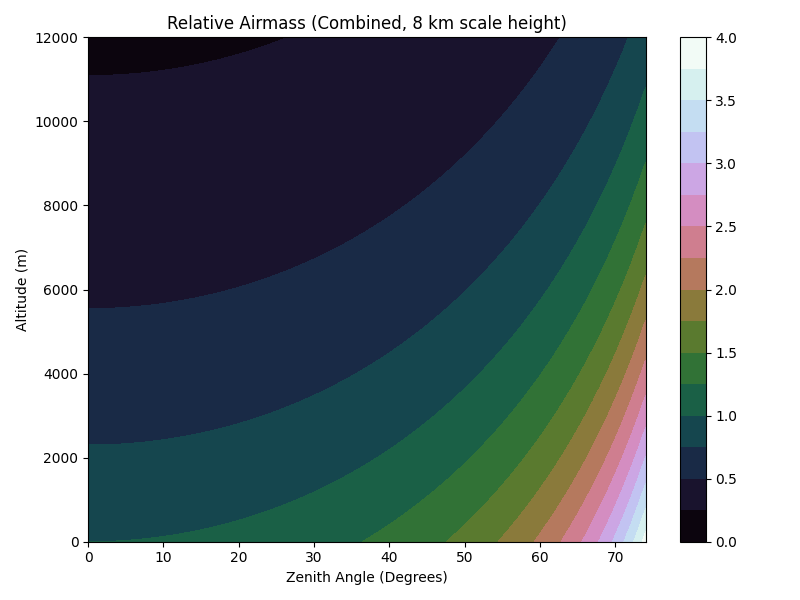
on site airmass/path length: \(l = \frac{1}{cos(θ_{zenith})}\)
airmass in atmospheres: \(a = exp(\frac{-altitude}{8400 m})\)
atmospheric opacity at a given wavelength: \(κ = (\frac{λ}{3080 Å})^4 + 0.09\)
transmission through the total air at that wavelength: \(exp(-κ \cdot l \cdot a) = exp(-τ \cdot l)\)
Graphs


Assumptions, utility, and other comments
The equation is calibrated to have one (1) optical depth at 6080 Å. In practice, this models both rayleigh scattering and a baseline of other scattering/absorption and particulates. It does not follow ‘real’ particulate scattering, which tends to have a much lower scale height (especially in/near optical), and is not line-by line. This is “good enough” for circa 3500-9500 Å, and adequate for ~3000-10’000 Å, despite not including ozone lines or that one big absorption line in the red. The lack of eg: water kills it in the IR proper, though. I’d like to eventually replace it with something more precise, and will take suggestions.
Aerosols in particular can vary vary enormously over time and by location. I’ve seen some models based off of the US Standard Atmosphere that include seasonal and/or latitudinal components for that reason. I’d probably get stuck with something empirical and per-site for them (as well as water vapor), though a more detailed model would be nice.
Sources / How
A pair of listings of emperical observations were hand-fit for the wavelength-dependent absorption: http://www.gemini.edu/sciops/telescopes-and-sites/observing-condition-constraints/extinction https://adsabs.harvard.edu/abs/1994IAPPP..57…12S
While not directly used, Hayes & Latham (1975), looks at multiple broadband and line absorption sources. Their categorization helped with organizing this, and I’d love to put together something that includes a few more lines.
If you want to recreate this, the graphs were generated with atmosphere.py, which also used extinction.csv and mauneakea.csv as data sources.